06 Jul Social Media Trends 2016: Must Know Stats
The 2016 Sensis Social Media Report was released last month and gives us insight into how people think, use and engage with Social Media. Sensis surveyed 800 consumers, 1,000 SMBs and 100 large businesses on how they use social networking sites such as Facebook, LinkedIn and Twitter.
If Your Business Does Not Have An Active Presence On Social Media, You’re Missing Out!
The 20 must-know stats from the 2016 Sensis Social Media Report:
Consumer Insights
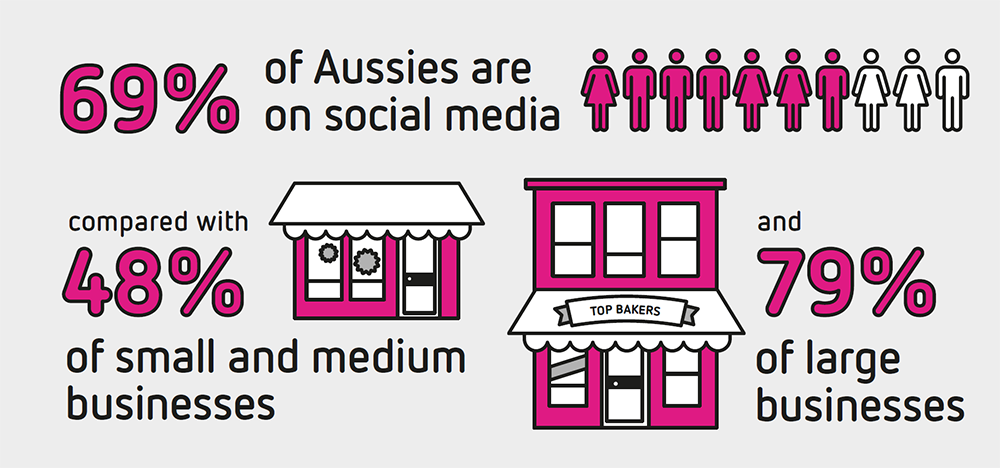
- 69% of consumers are now on social media, which compares to almost half (48%) of small and medium businesses and over three quarters (79%) of large businesses
How consumers are using social media
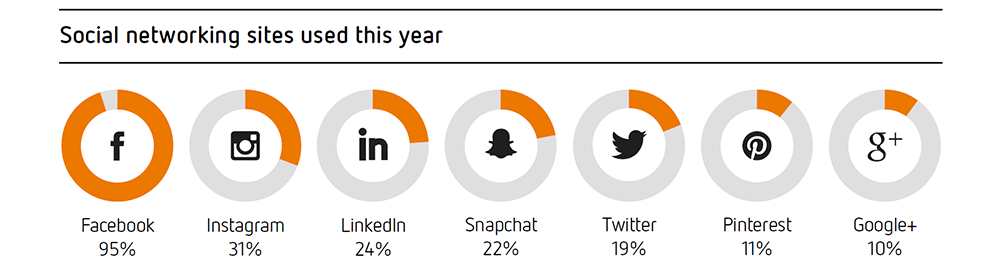
The most popular platforms
- Facebook is the most commonly used platform (up from 93% to 95%), followed by Instagram (up from 26% to 31%) and LinkedIn (down from 28% to 24%).
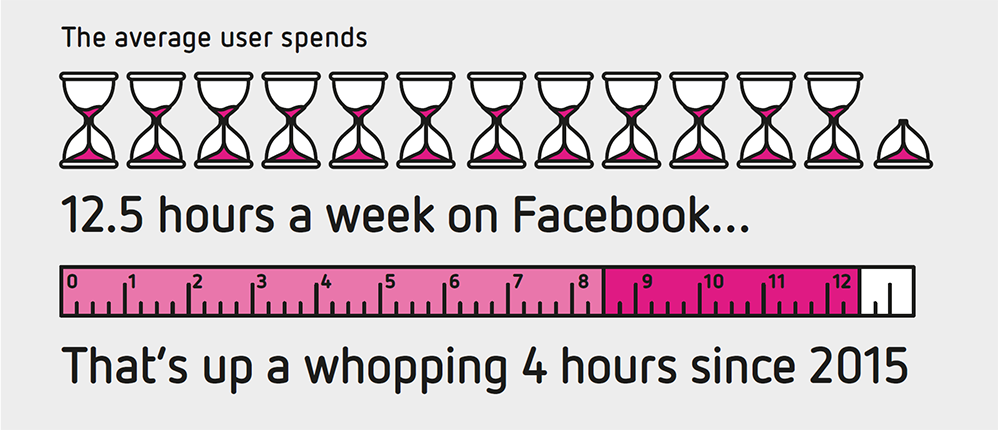
- The typical Facebook user now spends more than twelve and a half hours per week on the platform, which compares with around eight and a half hours last year.
How usage varies by age
- Not surprisingly, 18-29 year olds are the heaviest users, with 90% now on social media, versus the total average of 69%. They also have the most friends on Facebook (499) and are the most likely to use social media at work (49%), in the bedroom (67%), and on the toilet (19%).
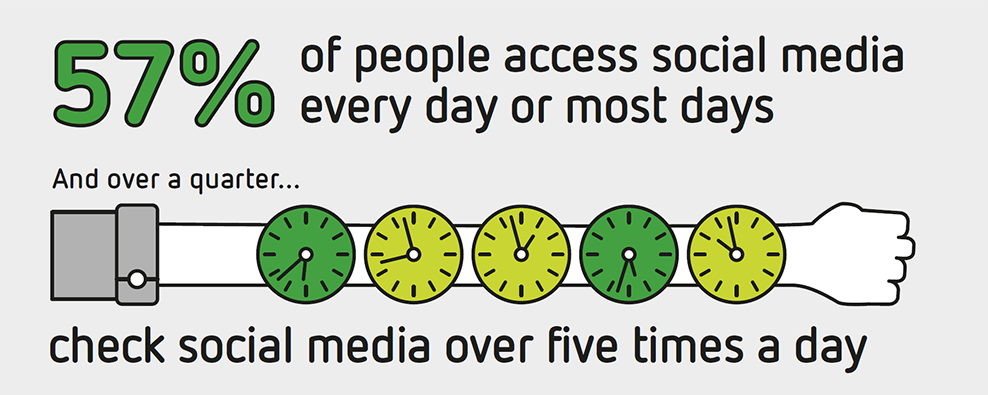
Frequency of use
- Frequency of use is increasing, with 57% accessing social media every day or most days (up from 53%) and 26% checking social media more than five times a day (up from 24%).
Where people are using social media
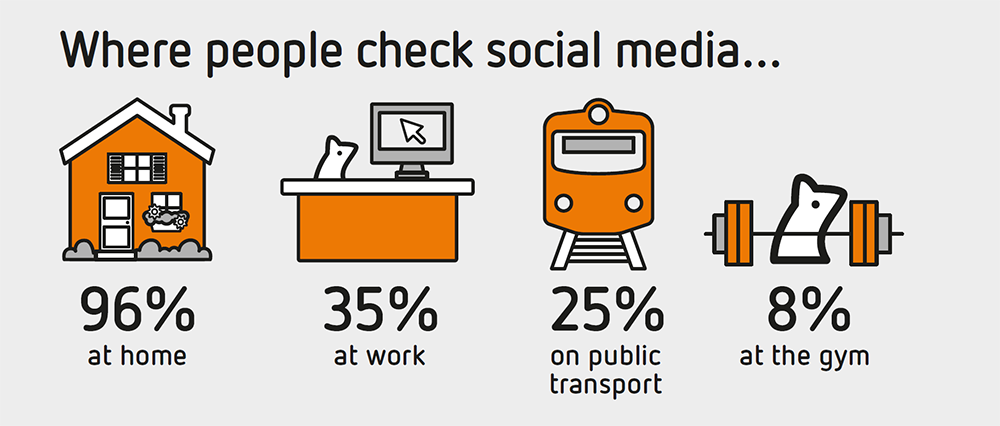
- The most common places people use social media are at home (up from 93% to 96%), at work (up from 32% to 35%) or on public transport (down from 26% to 25%). This year we also found that 8% of people are even using social media at gym.
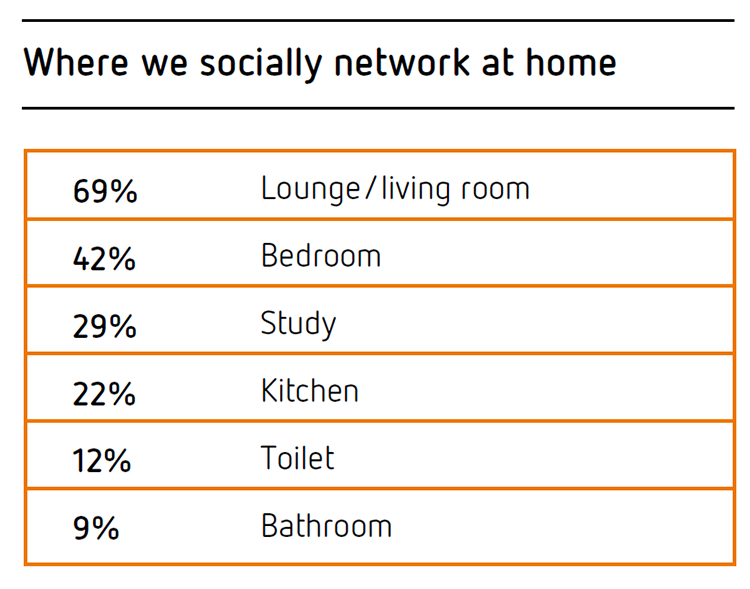
- Inside the home the most common places to use social media are the living room (down from 72% to 69%) and the bedroom (down from 43% to 42%). People are now using social media less in the bathroom (down from 14% to 9%) and toilet (down from 14% to 12%).
How men and women differ on social media
- Women prefer to use social media in the home while men are more likely to use it in all other locations, such as on public transport (30% vs 20%) or at the gym (12% vs 5%).
- Men are much more likely to use social media at work (44% vs 26%) and twice as likely to use social media on the toilet (16% vs 8%). Males (307) have more Facebook friends on average than females (240).
Most popular times
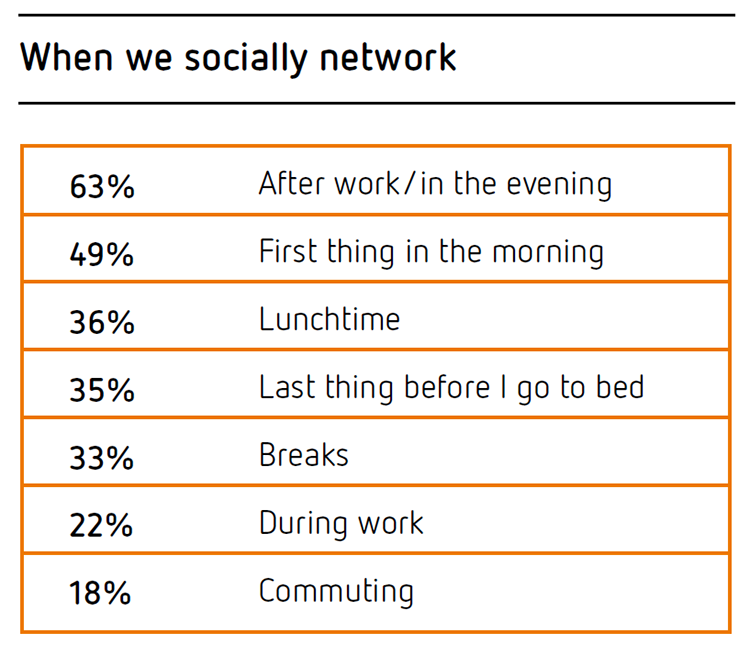
- The most common times to use social networking are in the evening (up from 40% to 63%) and first thing in the morning (up from 45% to 49%). The number using social media just before bed has dropped (from 41% to 35%).
How businesses are using social media
Growth in the number of businesses on social media
- The number of businesses with a social media presence jumped this year in every category, up from 31% to almost half (48%) for SMBs and from 56% to over three quarters (79%) for large businesses.
- Of those businesses that don’t currently have a social media presence a significant number expect to add one in the year ahead (17% of small, 13% of medium and 29% of large businesses).
Platforms businesses are using
- Businesses are most likely to have a Facebook presence (89% of small, 79% of medium and 89% of large businesses), followed by Twitter (24% of small, 43% of medium and 61% of large businesses) or LinkedIn (22% of small, 56% of medium and 59% of large businesses).
Quality engagement and content are crucial
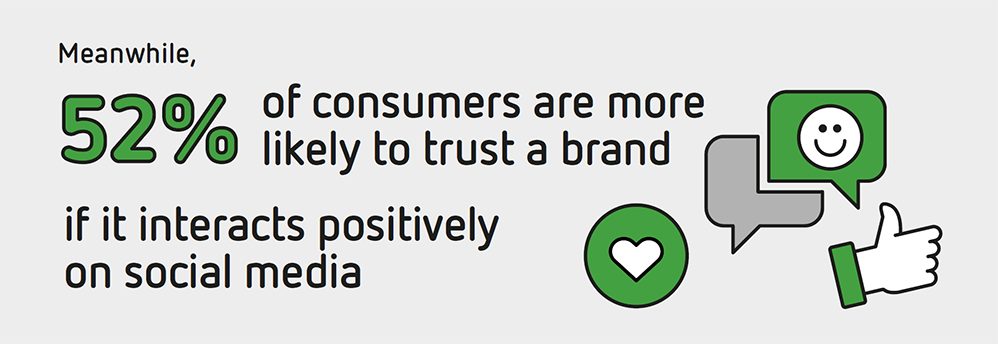
- Consumers are more likely to trust a brand if it interacts in a positive way with its customers on social media (52%), they find the content posted engaging and relevant (52%) and they regularly update their content (51%).
- The most common reason people stopped following a brand on social media was because of irrelevant or unappealing content (52%).
Social media as a driver of sales growth
- The proportion of businesses that believe social media investment will contribute to an increase in sales has grown in all categories, from 61% to 62% for small, 54% to 59% for medium and 58% to 68% for large businesses.
Advertising on social media
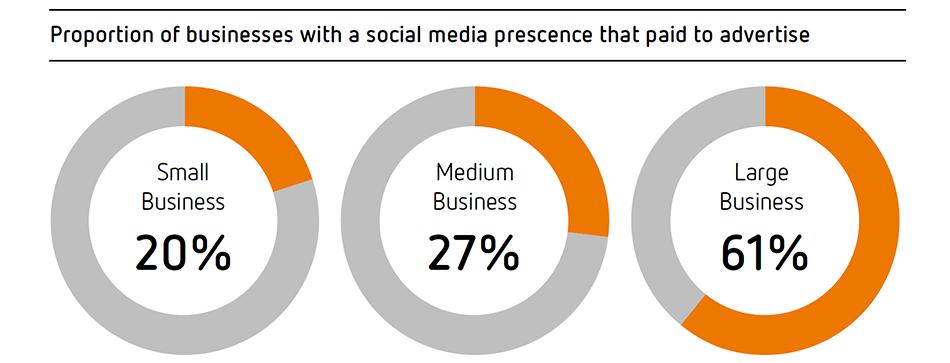
- There were mixed results in terms of the proportion of businesses that have paid to advertise on social media this year, going backwards for medium sized businesses (32% to 27%), showing modest growth for small businesses (17% to 20%) and strong growth for large businesses (46% to 61%).
- The most likely location for businesses to advertise is on Facebook, with 8 out of 10 SMBs and 9 out of 10 large businesses choosing to spend their advertising dollars there. LinkedIn, Twitter and Instagram are all gaining traction as channels for advertising.
Uptake across the states and territories
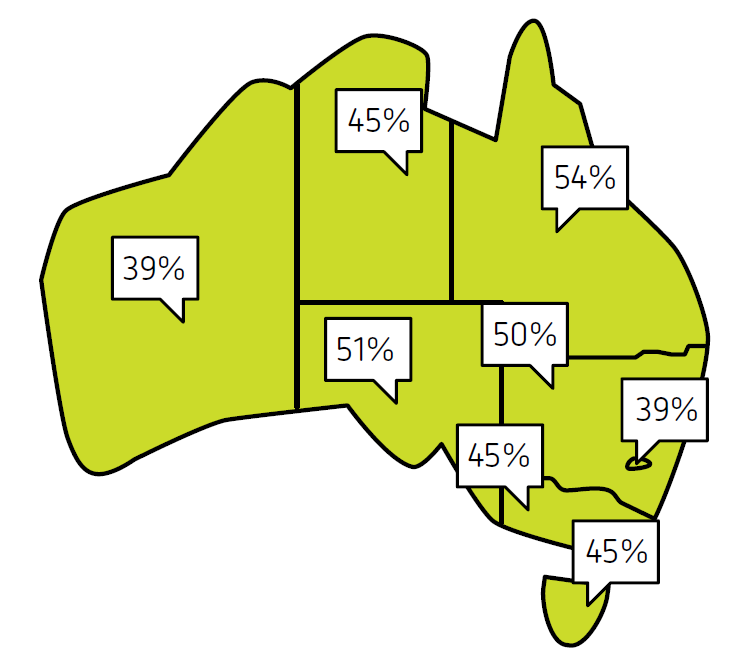
- There has been growth in every state and territory in terms of the number of SMBs with a social media presence this year. Queensland businesses lead the way (54%), while WA and ACT businesses (39%) are well behind.
Source: 2016 Sensis Social Media Report. Click here to read the full report.
newfocus is a national market research company, specialising in strategic market research and social research, with offices in Melbourne, Sydney & Adelaide.