09 Mar Is research daunting and statistics boring? We strongly disagree
Statistics are generally associated with quantitative research rather than qualitative and form an important part of an analytical and inferential stage of a research enquiry. While organisations are frequently encouraged to do research to gain a better understanding of the market environment or their customers, research and statistics unfortunately are perceived to be either somewhat daunting/challenging or even boring. Such perceptions are partly due to the abundance of statistical tests and techniques that can be applied to quantitative data (ie t-tests, ANOVAs, ANCOVAs, regressions, cluster analysis to name a few) and also little first-hand research experience within companies.
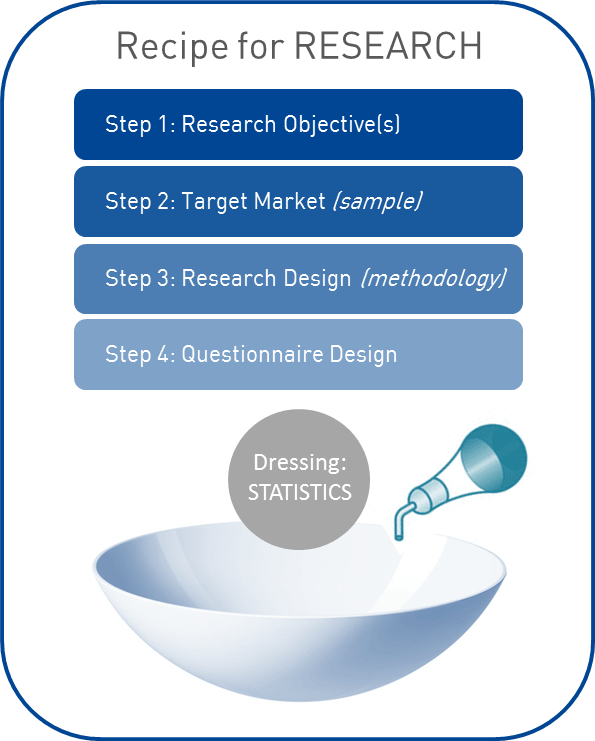 Can research be interesting, meaningful or exciting?Certainly! Let’s imagine research as a salad. As you know any salad requires the right ingredients and the right dressing, where both have equal importance for the success of a meal. In research, the ingredients are simple and include:
Step 1: Research Objective(s)
What is it that your organisation wants to get out of research? Is it a better understanding of your target market? Profiling of potential customers? Drivers and barriers to purchase? Or is it the reasons behind customer churn?
Next, is your organisation after general insights or strategic research with recommendations? In other words, why does your organisation require such research insights?
Setting the right objective or objectives is fundamental to successful research – your salad might not turn out right if objectives are too broad or not correctly spelt out.
Step 2: Target Audience (Sample)
Once the objectives are specified, it is relatively easy to identify the target audience/market to concentrate on. Now, are you after oranges or apples, or both? Picking the right target is just as important as determining the objectives – if the former is not specified accurately, and the “wrong” target audience is recruited, the ability for the research to deliver actionable insights is limited.
Step 3: Research Design (Methodology)
The research design is about determining the methodology of the research – how the data will be collected. Do you envision it as an online survey or a telephone survey (CATI)? While there are no set in stone answers, the optimal approach is usually determined by the objectives and the characteristics of the target market. Let’s take a look at an example:
Company A wishes to survey its customers to understand the most recent touchpoint experience. It has contact details which include both telephone numbers and email addresses. The best approach in this instance is to use a CATI methodology. Not only does it ensure that we are talking to the ‘right’ person, but also results in faster research turnaround and control over auto “clicks” in the case of online surveys.
Company B, however, operates only in NSW and VIC and in two months’ time wishes to assess a demand in SA. This time, research might require random telephone sampling to ensure results are representative of the general population. However, if the target group is hard to reach, research might require a collaboration with institutions that hold access to, or details of, those groups (ie panel provider) in which case it may turn out to be a mixed modal research approach (combination of online and telephone surveys).
Research design is about being in the right place at the right time with the right target audience.
Step 4: Questionnaire Design
This ingredient represents the content of a survey, which includes questions (sometimes referred to as “scales” or “variables”) which mainly measure and quantify social reality. As you may have already assumed, this is about asking the right question(s), which applies not only to the type of question (open-ended vs pre-coded) but also its format.
Common mistake with a type of question:
Please select all the reasons you purchase Brand A?
- Have always bought
- Has practical packaging
- My mum uses it
- No particular reason
The list of answer options is obviously non-exhaustive and an open-ended question is more suitable to probe for reasons behind a particular consumer decision-making process.
Common mistakes in the format of questions:
a) Omission of “don’t know”
Very often “don’t know” is omitted from answer options. However, it is better to have don’t knows than bias or mislead results when respondents genuinely have no clue how to answer a particular question. In fact, a high proportion of don’t know responses is a finding in itself indicating little consumer awareness, recall, or absence of strong attitudes, which can be used to leverage the brand through proper campaigns/advertising.
b) Omission of “other”:
Which of the following brands do you normally purchase…?
- Brand A
- Brand B
- Brand C
- None from above
- Don’t know
- Refused
Imagine you listed all Australian brands. However, there is a small proportion of consumers who purchase Brand Y online, which is manufactured in Europe. As respondents are forced to select “none from above,” your organisation will lose valuable information about the competitor environment. No matter how hard you try, the list will never be exhaustive. So, a smarter, safer approach is to include an “other (specify)” response option to capture trends in the market.
c) Double-barrelled questions / responses:
Consider the following question:
On a scale from 5 to 1, where 5 means strongly agree and 1 means strongly disagree, how much do you agree or disagree that Company A…?
- Offers fast and friendly service to its customers
- Has an effective problem resolution in place
- Provides value for money
While there is no problem with the second and third attributes, the first one asks respondents to evaluate Company A against two attributes at a time – fast and friendly.This is known as a double-barrelled response option. Logically, some respondents might agree that both are being delivered by the company. However, some may agree that the service is fast, though might not necessarily concede that it is friendly. In the end, the attribute is unreliable and inaccurate and it is unclear which one is being answered.
d) Omission of important variables/questions:
Are you able to effectively answer all of your research objectives with the questions in the survey?
Consider a frequently cited example of Coca-Cola’s market research fiasco of the 1980s. The company aimed to introduce a new, sweeter beverage (“New Coke”) and conducted a blind unbranded tasting study which showed that more than half of participants favoured the new product over the original formula and also Pepsi. Despite this finding, the new product did not pick up because research failed to account for customers’ emotional involvement with the brand. The assumption was made that taste represented the key deciding factor in consumer choice. Also, participants were not asked during the test whether they would give up any products. Had these key questions been included in the research, the company would not have suffered financial loss after it withdrew the original product and introduced the “New Coke”. To read more about this study, visit: http://www.qualtrics.com/blog/coca-cola-market-research/
Final Step….Add the Dressing: Statistics
Once data collection is complete, here comes the exciting part – statistics! In short, statistics are responsible for how finely you want your data to be chopped, sliced or split to deliver meaningful, actionable insights.
Although this is the final step, it is crucial that the ‘thinking’ about how you want to present your data/ use statistical analysis is done at the questionnaire design stage. If you don’t have the right questions, you may not be able to perform the analysis you so desire.
Let’s have a look at perceptions about Company A’s effective problem resolution. Do you want ‘aggregate data’ for this attribute, or would you like to compare results depending on ‘membership type’, ‘age’, ‘state’? Next, should you calculate an average or should you examine the proportions of the top two box (T2B) (‘strongly agree’ and ‘agree’) and bottom two box (B2B) (‘strongly disagree’ and ‘disagree’) in your data? If you choose an average, what does a mean score of 3.8 tell you? That the respondents ‘neither agree nor disagree’ but still lean toward ‘agree’?
Going one step further, are you after descriptive statistics (ie mean, mode, median, T2B and B2B) or more strategic insights, such as an analysis of drivers behind customer satisfaction or purchase behaviour (ie regressions)? The latter, for example, can be used to assess whether fast and friendly service, effective problem resolution and value for money result in a higher probability of customers recommending Company A’s business among their friends, family, etc (advocacy measure – “On a scale from 0 to 10, how likely are you to recommend Company A to your friends and family?”). Regression is also useful in identifying the strongest predictor among the three variables, thus, allowing the business to concentrate its resources on the key driver to leverage/improve the business.
If you want to go one step further and group/segment your customers based on specific attributes, cluster analysis can be used. If you are interested in how fast and friendly service, effective problem resolution or value for money relate to each other,correlations or a factor analysis should be used – they can, for example, show that positive perceptions about effective problem resolution are associated with fast and friendly service, but not with value for money as the latter might not necessarily tap into the “problem resolution” dimension.
Finally, how can one make statistics more exciting? When presenting/summarising the results of the performed analytical tests use visuals rather than tables, pick key insights, highlight key statistics, and be creative!
Research is an exciting and yet challenging analytical journey.
However, with the correct ingredients and dressing, the salad will most likely turn out right!
Written by: Mila Tarabashkina, Research Analyst
newfocus is a national market research company, specialising in strategic market research and social research, with offices in Melbourne, Sydney & Adelaide.